New York Virus S-Curve 2 Weeks Behind Italy, U.S. 3 Weeks but Longer Tail
First, what do I mean by a longer tail for the U.S.? Here, we have a progression of the virus across states just like Europe has a progression of the virus across countries from Italy to the U.K. We have a broader and more varied urban/rural and climate array.
The virus is progressing through New York much like through Italy on a normal S-Curve, while the across the U.S. it is skewing out towards a later marked slowdown, as the virus accelerates in one state after the next – but not expected to be as intense or extreme as New York which has the densest metro population and one of the colder climates.
There’s a new website that focuses on deaths (not infections) state-by-state in the U.S.: www.covid19.healthdata.org/projections. These guys get the S-Curve progression!
Note that deaths lag infections by about 3 – 5 days and the death rate rises as the health systems get overloaded, among other reasons.
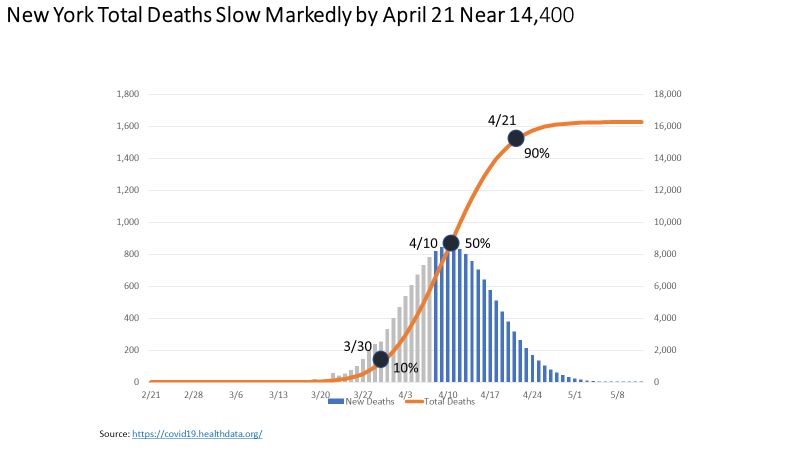
Here are the projections for New York, the state that has dominated the U.S. thus far – it’s the epicenter here like Italy is the epicenter in Europe.
New York Deaths Slow More Markedly by April 21 Near 14,400
Note in this chart that the daily deaths (grey/blue bars), or rate of growth which is the most critical to forecasting the S-Curve, is largely symmetrical, as is normally the case, and like the Italy chart I showed on Wednesday. Peak deaths are expected around 855 per day around April 10 – a week from now. Total deaths are projected to be about 16,000, but the end of the 10% to 90% acceleration stage should be hit by around April 21 at around 14,400. That means cases/infections should slow down a bit earlier, around April 16 – 18.
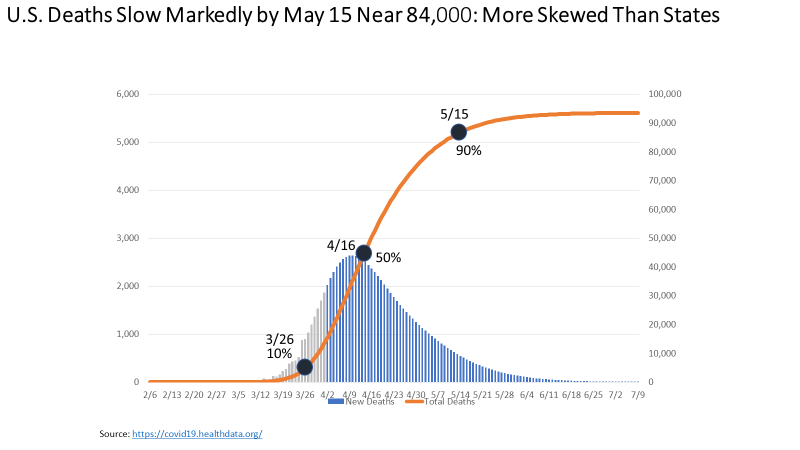
The U.S. chart does skew more forward as it progresses from state to state. The state S-Curves are similarly symmetrical, but it is a progression that starts fast in leading states like New York/New Jersey and then spreads to less prone and deadly states.
U.S. Death Rates Slow More Markedly by May 15: More Skewed Than States
If you look at the daily deaths here, they have a longer tail after peaking at an accelerated rate. The deaths take longer to slow markedly at 90% and to slow back down to near zero at 99.9%.
Although the peak number of deaths are forecast to occur around April 16 at around 2,650, the marked slowing point at 90% will stretch more out towards May 15. I think their projected total death rates of near 94,000 are likely to be too high. Many states are just starting to accelerate and I think they are assuming those accelerations will be more like New York. I see them being less intense due to lower density, warmer weather and faster reactions when symptoms show in most states. I’ll wait for a few more weeks of data. But note that even their projections are lower than the 100,00 – 240,000 range given by Trump’s new expert team.
My view here is that a marked slowdown in the epicenter of New York/New Jersey will give people and the markets a sigh of relief around mid-April following the more noticeable slowdown in Italy and Spain between April 7 and 13.
That’s when the markets are most likely to hit that 3 to 5-month-plus historic bear market rally before the big crash hits between later this year into late 2022. Andy Pancholi and I have separate indicators that point towards April 13 – 15 as a potential turn date for the markets as well.